Comparing cultivars yield
In this tutorial we are going to compare the cultivar yield across different cultivars using apsimNGpy
Firstly, we are going to start by creating a none permutation experiment
from apsimNGpy.core.apsim import ApsimModel
model = ApsimModel('Maize')
model.create_experiment(permutation=False)
model.add_factor(specification="[Sow using a variable rule].Script.CultivarName =  Dekalb_XL82, Melkassa, Pioneer_34K77, Laila, B_110, A_90")
model.run()
df = model.results
Note
Cultivars Dekalb_XL82, Melkassa, Pioneer_34K77, Laila, B_110, A_90 were selected randomly for demonstration purposes only. We also assumes that they are planted in the same field, therefore, same weather and soil factors.
To see all the available cultivars and select from a list use:
model.inspect_model('Cultivar', fullpath=False)
getting info about the simulated output
import pandas as pd
pd.set_option('display.max_columns', None)
df.info()
# output
<class 'pandas.core.frame.DataFrame'>
RangeIndex: 60 entries, 0 to 59
Data columns (total 18 columns):
 #   Column                            Non-Null Count  Dtype
---  ------                            --------------  -----
 0   SimulationName                    60 non-null     object
 1   SimulationID                      60 non-null     int64
 2   CheckpointID                      60 non-null     int64
 3   CheckpointName                    60 non-null     object
 4   Clock.Today                       60 non-null     object
 5   CultivarName                      60 non-null     object
 6   Experiment                        60 non-null     object
 7   Maize.AboveGround.N               60 non-null     float64
 8   Maize.AboveGround.Wt              60 non-null     float64
 9   Maize.Grain.N                     60 non-null     float64
 10  Maize.Grain.NumberFunction        60 non-null     float64
 11  Maize.Grain.Size                  60 non-null     float64
 12  Maize.Grain.Total.Wt              60 non-null     float64
 13  Maize.Grain.Wt                    60 non-null     float64
 14  Maize.Phenology.CurrentStageName  60 non-null     object
 15  Maize.Total.Wt                    60 non-null     float64
 16  Yield                             60 non-null     float64
 17  Zone                              60 non-null     object
dtypes: float64(9), int64(2), object(7)
memory usage: 8.6+ KB
# most of the columns in the dataset are float
other alternative:
df.describe()
Since our major factor is CultivarName, we will next examine the corresponding mean yield for each cultivar
mean_yields = df.groupby('CultivarName')['Yield'].mean().sort_values(ascending=False)
print(mean_yields)

# output
CultivarName
Laila            6610.2287
Pioneer_34K77    6608.3364
B_110            6535.0578
A_90             6286.9042
Dekalb_XL82      5611.6749


Melkassa         4831.0817
Name: Yield, dtype: float64
Clearly Melkassa has the lowest yield, and laila performed better than all other cultivars. Let’s take a step further and visualize their mean, median, minimum or maximum values using a boxplot
from matplotlib import pyplot as plt
model.boxplot('Yield', by = 'CultivarName', figsize=(10,8), rotate_xticks=False, show=True)
plt.show()
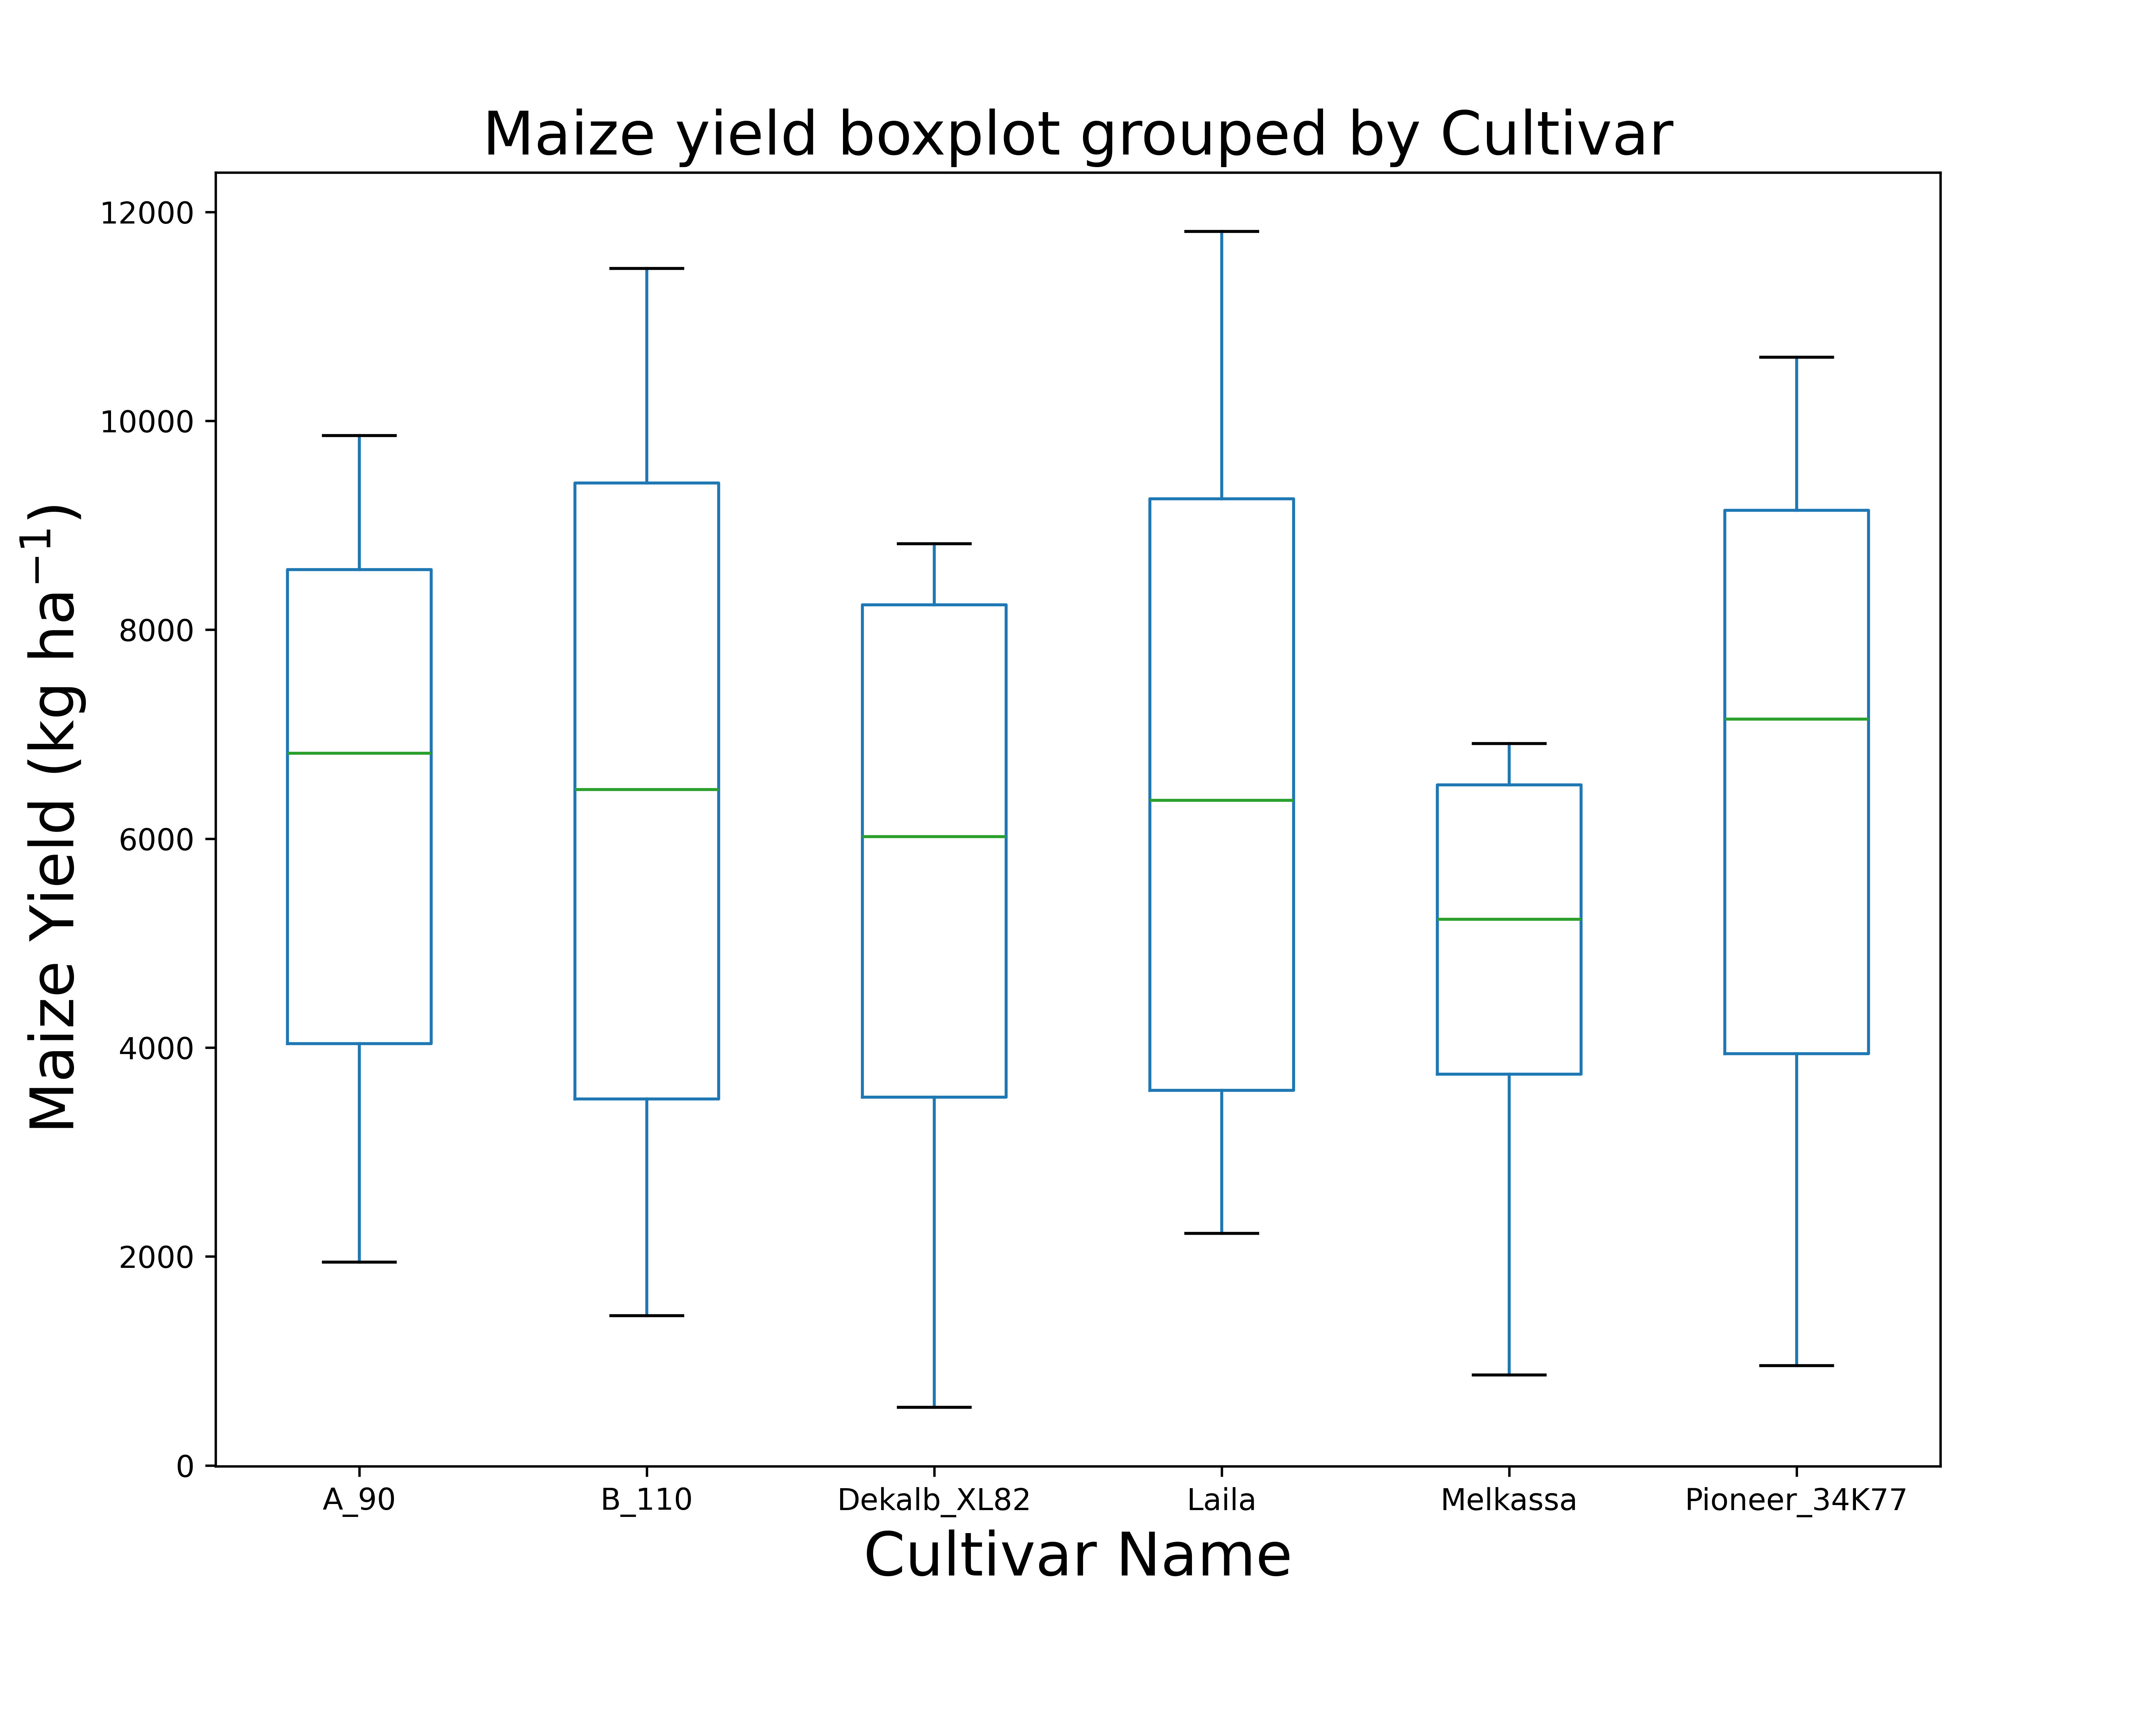
Obviously, there is no doubt Melikassa performs poorly in this area in terms of maize yield quarterly percentiles and median are very different fom the rest of the cultivars.
Meanwhile Laila and ``B_110` are similar, but different from that of Dekalb_XL82
model.series_plot(x= 'Year', y= 'Yield', hue='Cultivar')
plt.show()
Variability across the simulation years
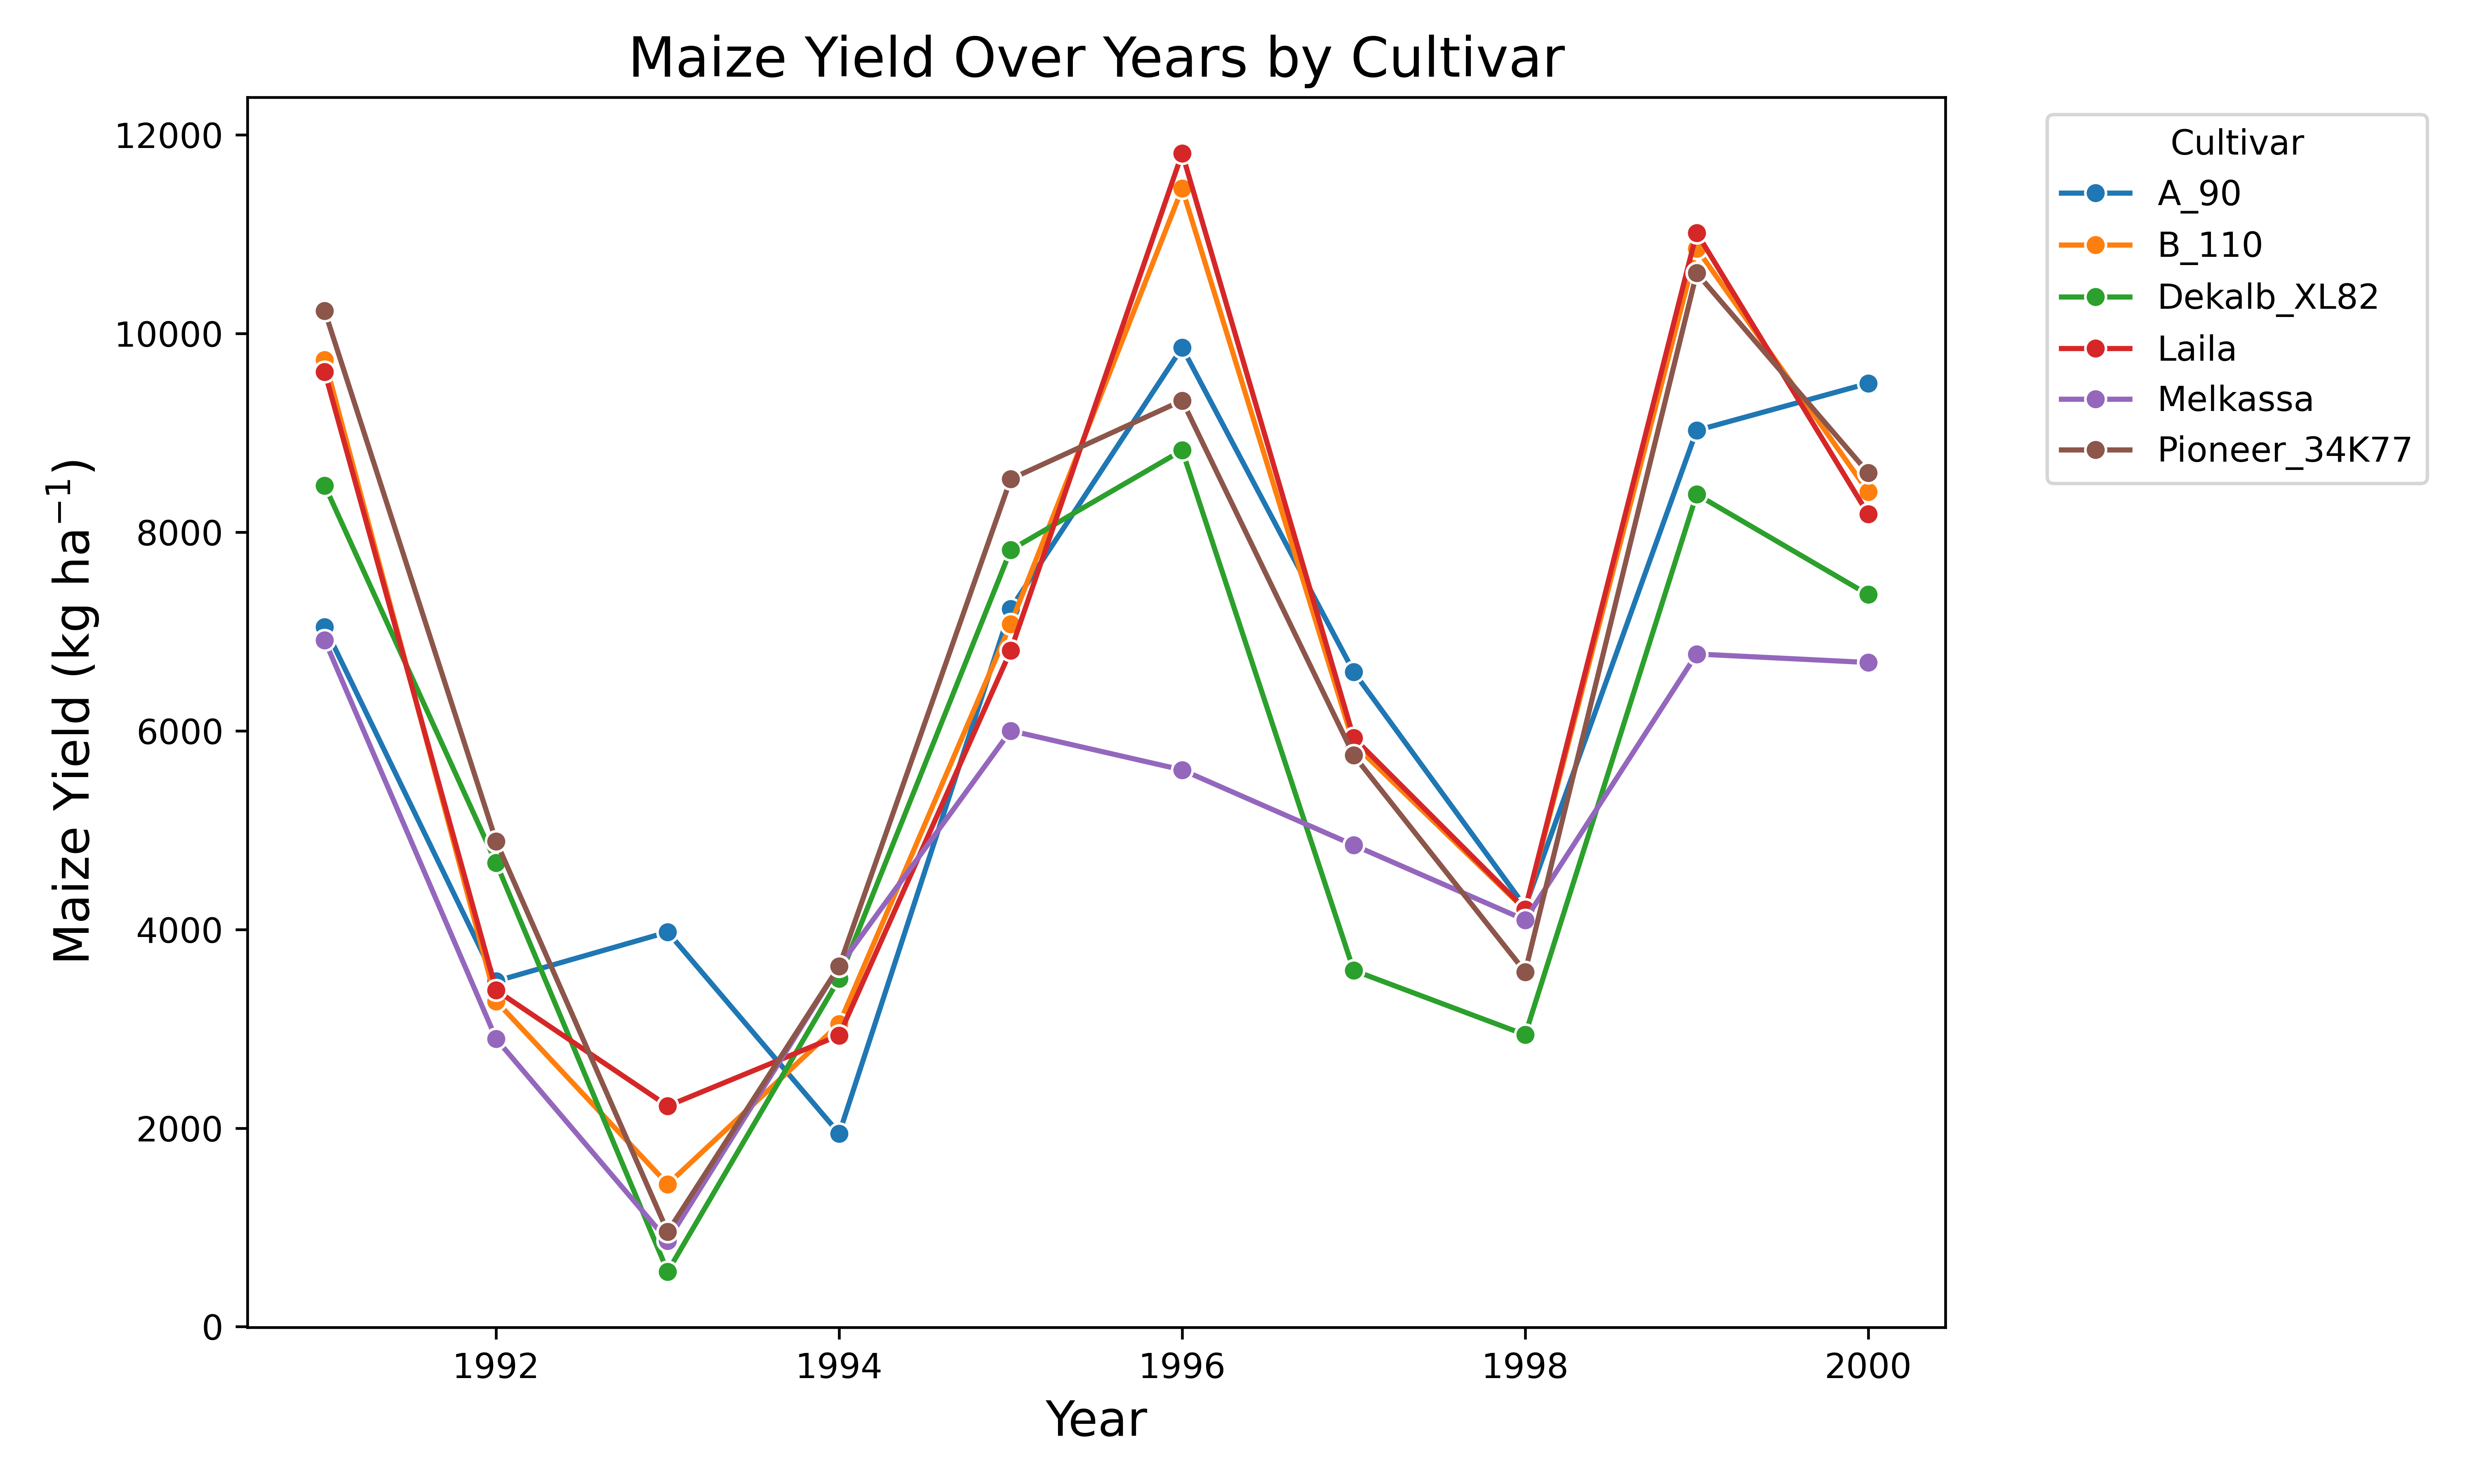
All cultivar had the same annual yield trend but there is a year when a_90 had more maize yield than all the others
See also